Understanding Royalti Analytics & Reports
What This Covers
Royalti's dashboard and Analytics workspace turn your raw royalty data into charts, tables, and downloadable reports. This guide explains what each part of the dashboard shows, how to compare periods and save your own views, and how to export a branded report, including who on your team needs admin access to see it.
The Dashboard: Your at-a-Glance Summary
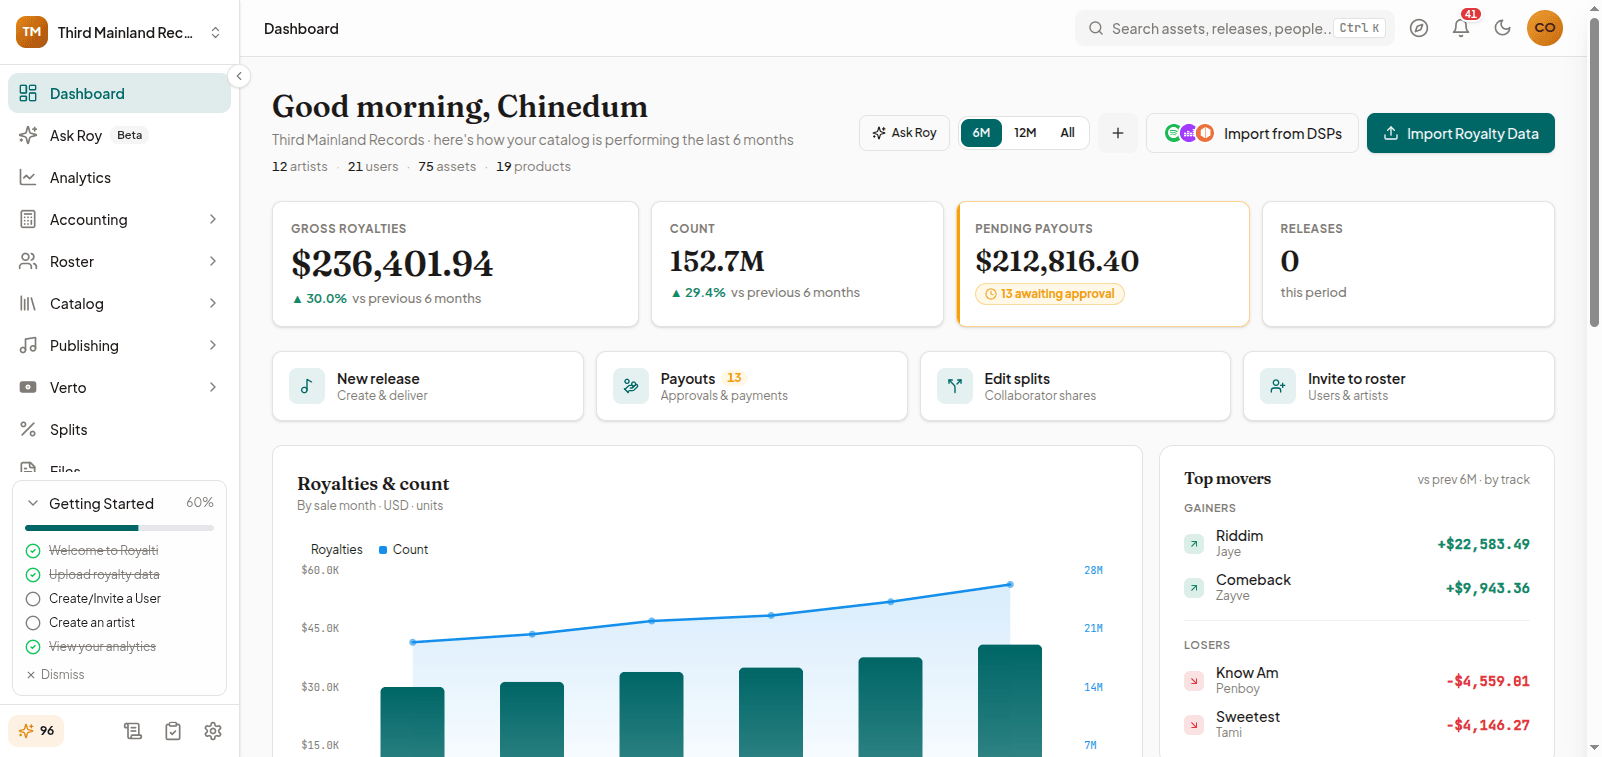
Your Dashboard is the first screen you land on after logging in. It shows:
- A period selector: 6 Months, 12 Months, or All Time that controls every chart and summary card on the page.
- An all-time chart option: with no data cap, so you can see royalty trends across your entire catalog history, not just a recent window.
- Summary cards for royalties, top artists, releases, and products, scoped to the period you've selected.
Switching periods updates the whole dashboard at once, so there's no need to re-filter each card individually.
The Analytics Workspace: Deeper Reporting
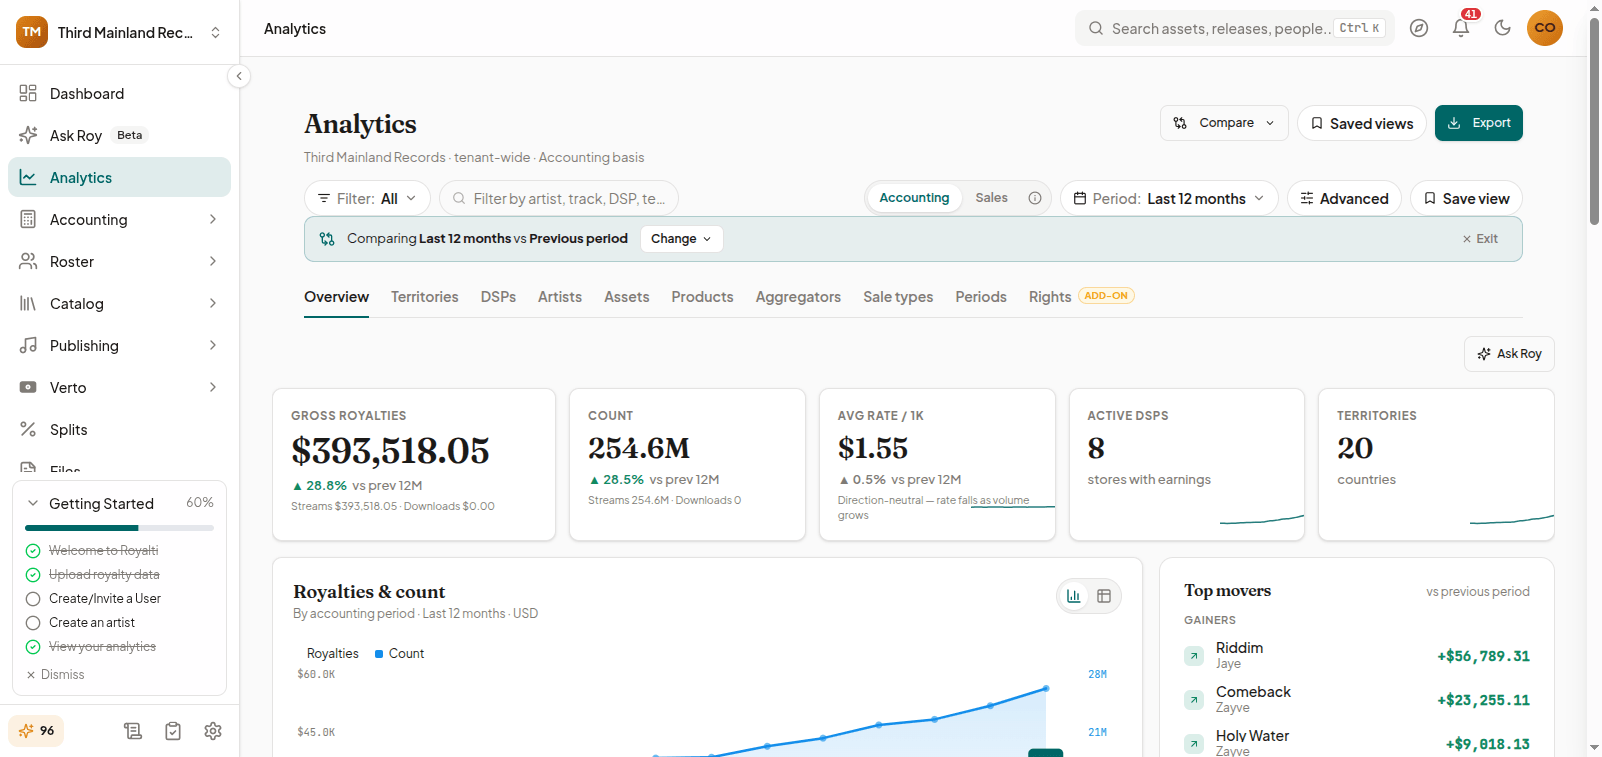
For deeper analysis, open Analytics from the sidebar. It's organized into tabs: Periods, Artists, Products, Assets, DSPs (stores), Territories, Sale Types, Aggregators (sources), and more, each breaking down your royalty data by a different dimension.
Compare Mode
Use Compare to put two periods, or two entities (for example, two artists or two DSPs), side by side and see the difference directly, instead of switching back and forth between separate views.
Saved Views
If you find yourself applying the same filters repeatedly, say, a specific artist plus a 12-month window, save it as a Saved View. Saved views sync to your account, so they're available the next time you log in, and you can:
- Pin a view as your default
- Rename or duplicate a saved view
- Delete views you no longer need
The Rights Tab: One View Across Income Types
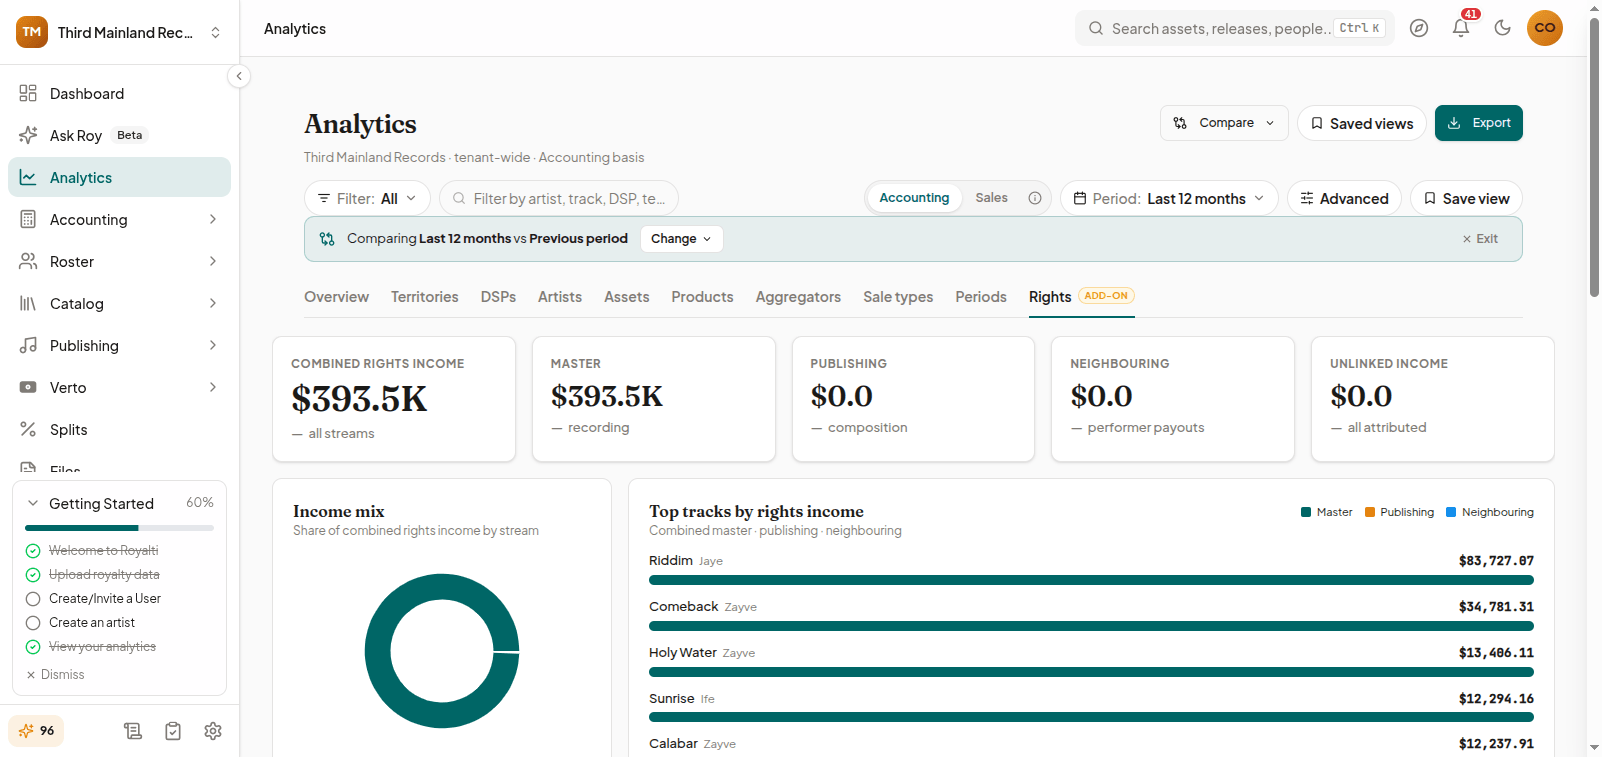
Most royalty data lives in separate silos, recording (master) royalties, publishing (composition) royalties, and neighbouring-rights payouts. The Rights tab consolidates all three into a single per-track view, so you can see combined earnings without cross-referencing multiple reports. It also flags:
- Approximated publishing figures, where the exact split isn't fully confirmed yet
- Unlinked income, earnings that haven't been matched to a work or composition, with a shortcut to review and link them
The Rights tab is admin-only; it doesn't have a member-facing equivalent.
Exporting Reports
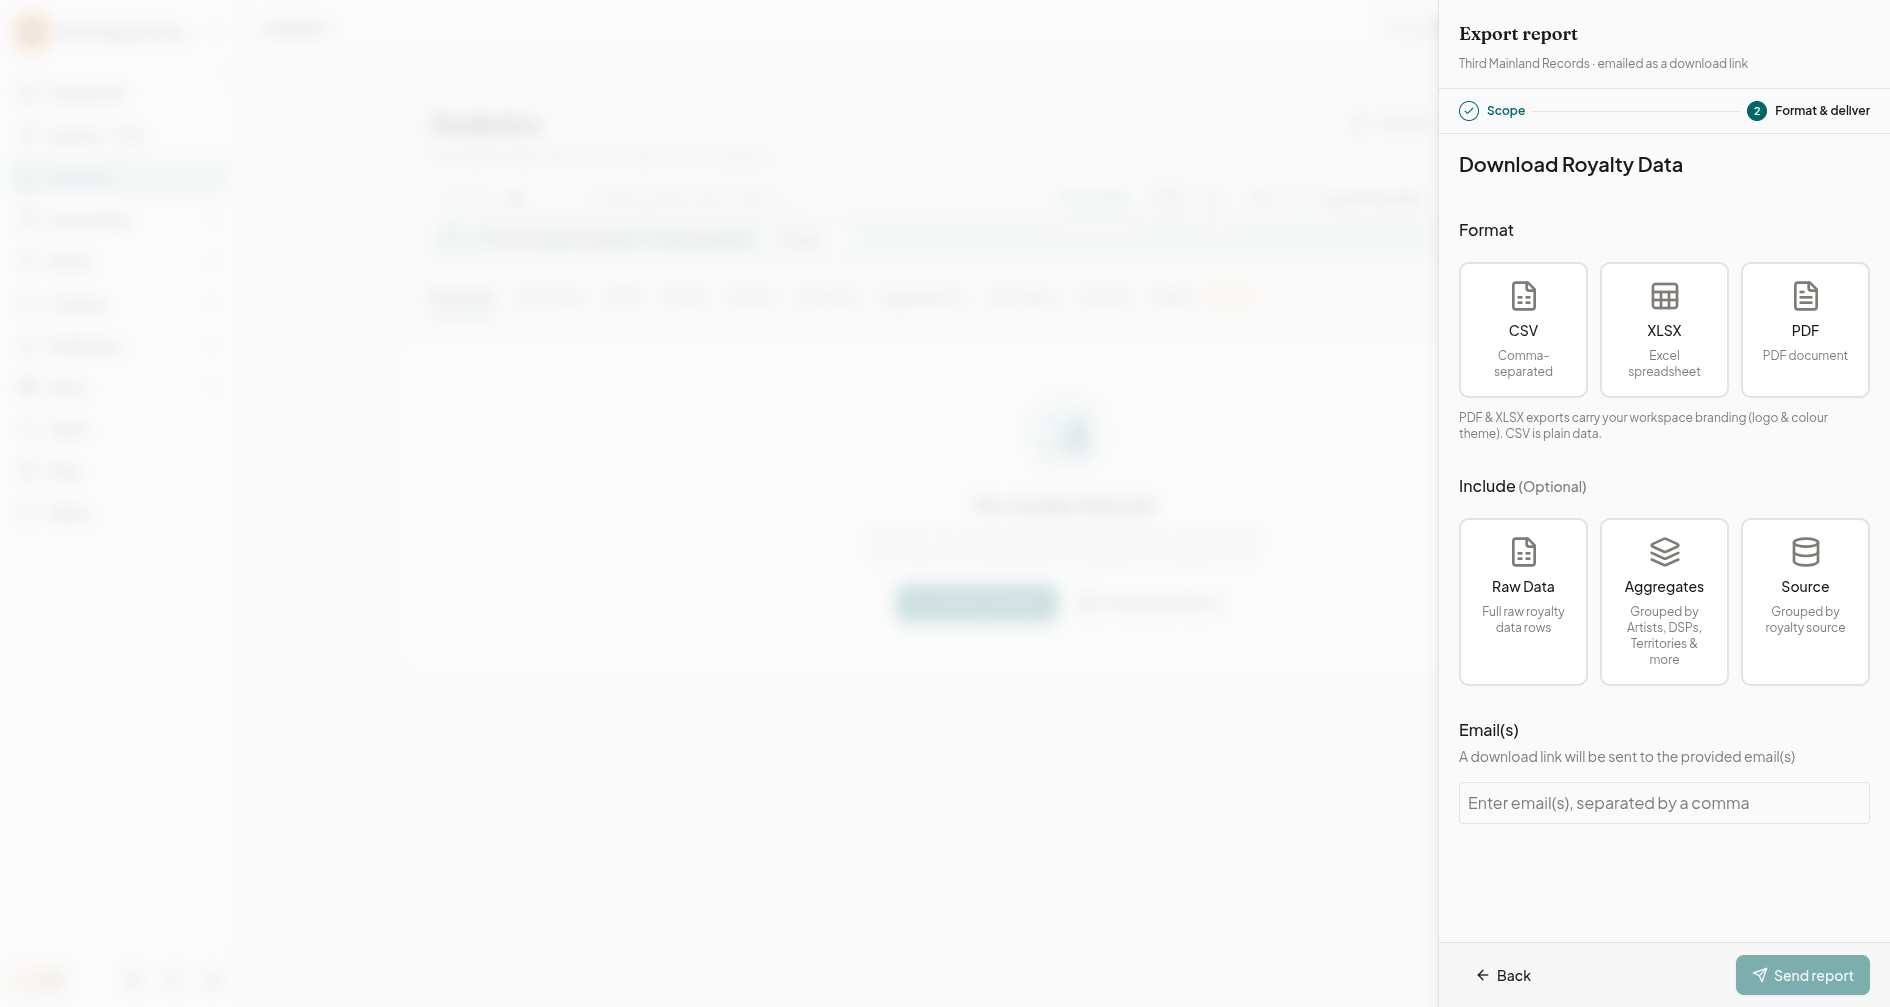
You can export analytics data in three formats:
- CSV: comma-separated raw data
- XLSX: Excel spreadsheet
- PDF: a formatted, branded document
When you export, you also choose what to include:
- Raw Data: the full underlying royalty rows
- Aggregates: data grouped by artist, DSP, territory, and similar dimensions
- Source (admin only): data grouped by royalty source/aggregator
PDF and Excel exports use your workspace's branding, your logo, and color palette, so reports you share with artists or partners look like official label documents rather than generic spreadsheets.
Per-card Export
Individual cards inside a breakdown view (for example, a single chart or table) can be exported on their own as a PNG image, CSV, or JSON, using the export tool on that card, without generating a full report.
Export templates
Admins can save reusable export templates that remember your preferred columns, filters, and format, so recurring reports (like a monthly label summary) don't need to be rebuilt from scratch each time.
Who Can See What: Role Gating
Analytics and reporting screens are gated by your role within the workspace, not by your subscription plan:
| Role | Access | |---|---| | Guest / User | Their own personal analytics (My Analytics), scoped to their own catalog share | | Admin / Owner | Full tenant-wide Analytics, Rights tab, Source exports, and reporting |
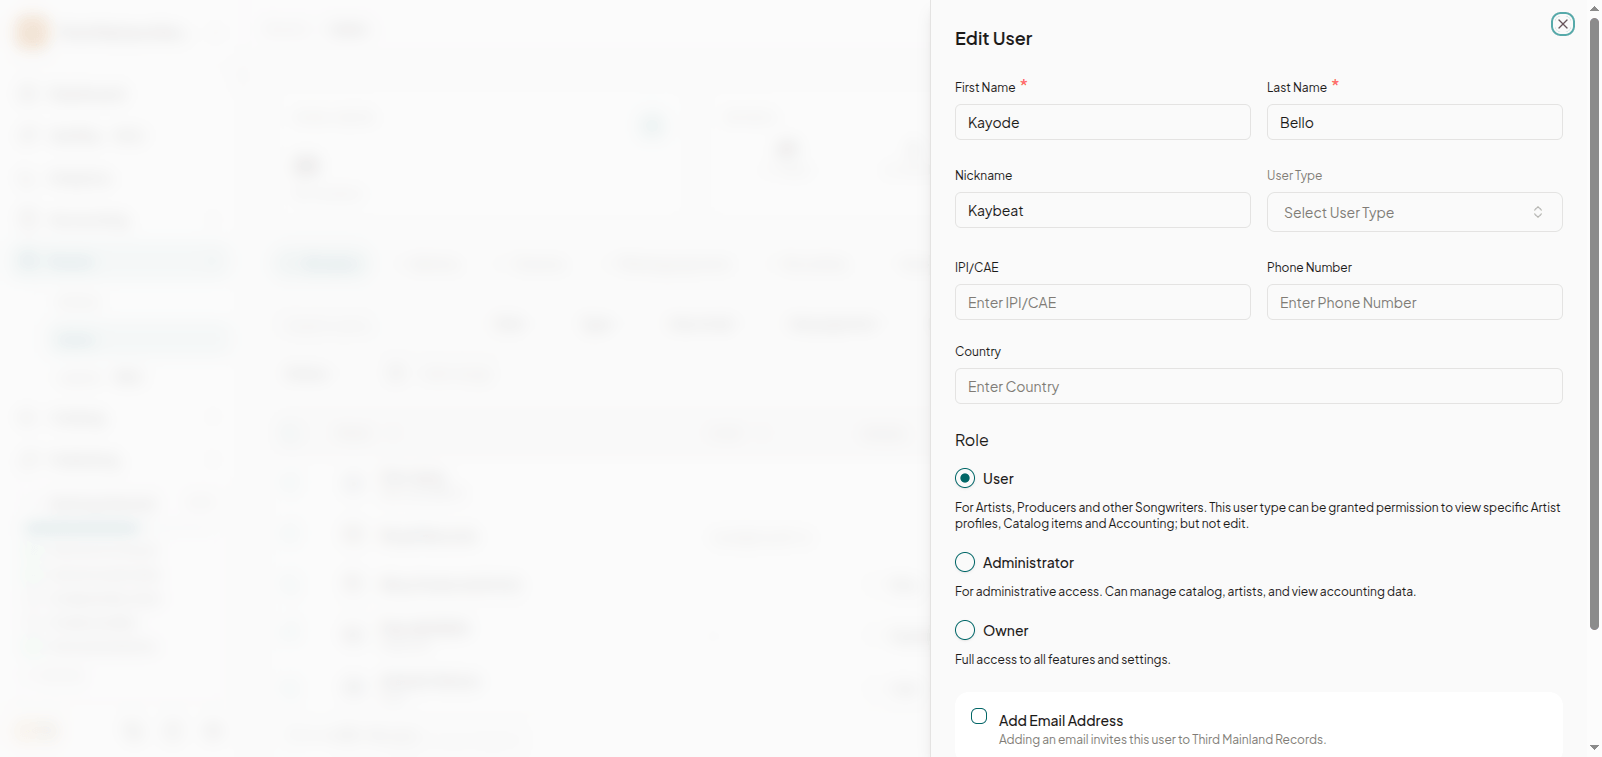
If you or a team member sees a message like "Insufficient permission. Admin access needed" when trying to open a report, it means that person's workspace role is below Admin, not that your plan lacks the feature. To fix it:
- Go to your workspace's user management screen.
- Find the person's account.
- Change their role from User to Admin (or have your workspace Owner do this).
No plan upgrade or add-on is required; this is purely a role setting.
What's Next
- Learn how saved views and filters work across the whole Analytics workspace.
- See how branded PDF statements are generated for artists and partners.
- Set up user roles and permissions for your team.
If you're not sure which role a teammate needs, reach out to Royalti support, and we'll help you get everyone the right level of access.
Still stuck?
Support answers within one business day — usually much faster.